… when it’s an investment.
The rot started before Thatcher: she merely picked up on a changing public mood.
We’ve been talking about houses as investments for many years now and it distorts completely any rational discussion about Britain’s housing needs. The idea of “an Englishman’s home is his castle” has been around for centuries. But then people started seeing houses as more than the place where you put down your roots, live your life, bring up a family, socialize with friends and become part of your community.
For most goods and services, a price rise is generally seen as a bad thing, reducing people’s disposable income and risking a rise in inflation. Not so with housing, where a reverse logic applies. This upside-down view comes naturally for richer politicians, economists and journalists who are on the (capital) gaining side of the equation.
Housing Divides Us
But the practical result is that, as Britain becomes a more and more divided society, one of the stark distinctions between the “haves” and the “have-nots” is the ability to afford a home of your own. Those lucky enough to be homeowners already have been able to use their unearned capital gains in a variety of ways. But would-be first time buyers are being put in an ever more desperate position. The maps below show the contrast in housing affordability over the past 20 years, based upon average* incomes and average house prices, area by area.
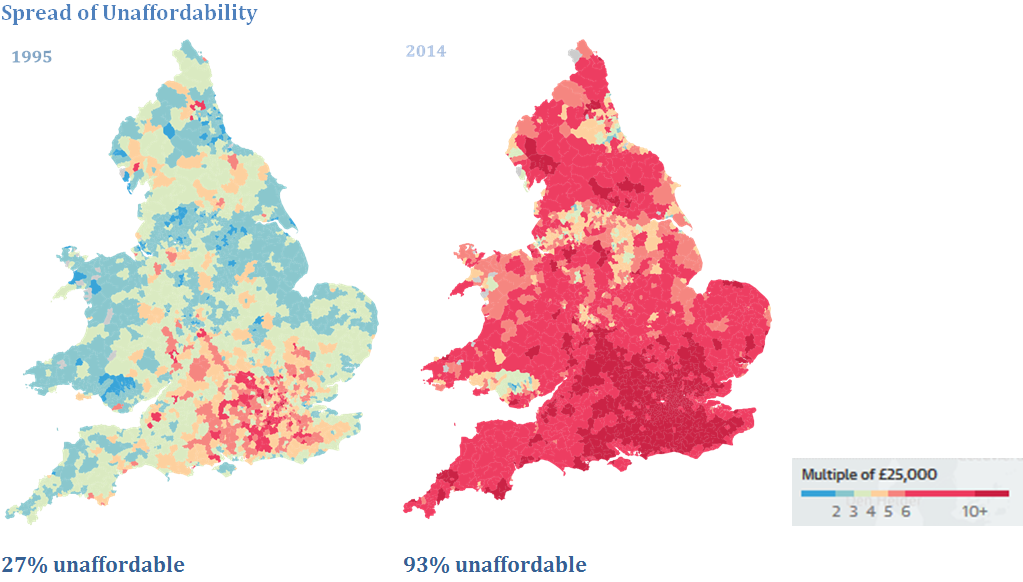 With blue the most affordable and red the least, the change is dramatic. In 1995, an average earner would need to spend between 3.2 and 4.4 times their salary to buy an average-priced house in their area. In 2014, the corresponding figures are between 6.1 and 12.2 times salary. In both years, unsurprisingly, the highest ratios are for London. Here, average earners now stand no chance of getting onto the housing ladder without the help of rich parents or some other equivalent advantage.
Too Few New Houses
How we came to this ridiculous state of affairs is easy to see when you look at the graph below, showing UK house building over the past 45 years. From an annual figure of around 300,000 new homes in the 1970s, often higher, the rate drops sharply following the oil price shock of the mid-1970s. After a small rally in the early 1980s, it falls to 180,000 at the end of the Thatcher and Major governments. A steady but modest rise occurs in the housebuilding rate in the New Labour period prior to the 2008 financial crisis. The crash resulted in new lows of fewer than 150,000 new homes a year, a rate which failed to recover under the 2010-15 coalition. Housing experts state that we need 200-250,000 new homes a year to keep up with demand.
The Rise of the Private Landlord
Matters have been made worse by a huge rise in the buy-to-let market. A significant proportion of former council properties, sold off after Thatcher’s “Right to Buy” policy, have eventually ended up on the buy-to-let market. The graph below shows trends over a 10 year period to 2012.
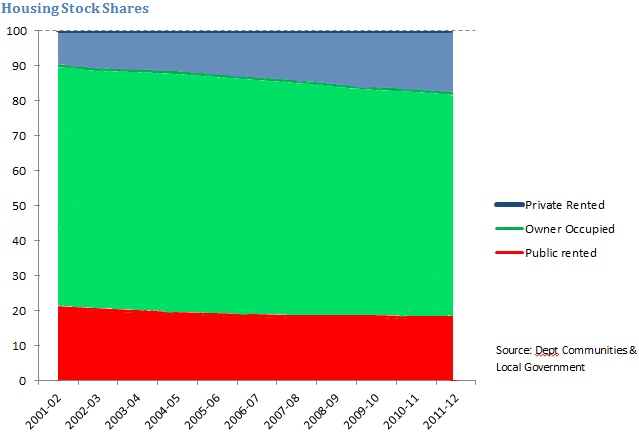 During this period, the total housing stock has risen from 25.6 million homes in 2001-2 to 27.8 million ten years later. The proportion of public sector homes fell from 21% to 18% as new public sector house building failed to keep pace with the loss through council house sales. A more dramatic drop in owner-occupied properties, from 69% to 64% demonstrates the increasing problem for first time buyers to enter the market. The slack, as can clearly be seen, has been taken up by the private rented market. Its share of the housing stock has nearly doubled, from just under 10% to 18%.
Increasing Benefits Bill
The insufficiency of house building over a long period, together with a major swing to the private rented sector has driven up housing costs dramatically, even more for those renting than for owner-occupiers. The consequential rising cost of housing benefit is one of the two major causes of the rise in social security costs over the last decade or two. (The other is our ageing population, whose pensions have been protected.) The extra public spending has gone to private landlords.
Conclusion
It does not need much mental effort to conclude that:
- The UK housing market is dysfunctional
- Those suffering most are those least able to afford decent housing
- Benefit caps pile more suffering on those same people
- Osborne’s plan to sell off the more desirable Housing Association stock simply makes the problem worse:
- It will shift more housing from public to private rented
- It will drive up average rents
- Jeremy Corbyn’s “People’s Quantitative Easing” to pay for more public housing looks quite sensible:
- It will increase the supply of genuinely affordable housing
- It will reduce the benefits bill.
And all because we’ve been conditioned into seeing houses as financial investments instead of homes!
*median figures used throughout
Acknowledgements to: theguardian.com (03/09/2015), Channel 4 and the Office of National Statistics for source data