One of the assertions made by free market fundamentalists is the “trickle-down effect”: making rich people richer by cutting their taxes benefits everyone, as their extra wealth trickles down to the rest of us. I have long doubted this; a recent IMF report provides further evidence that this is not so.
To quote from the report:
“If the income share of the top 20 percent increases by 1 percentage point, GDP growth is actually 0.08 percentage point lower in the following five years, suggesting that the benefits do not trickle down. Instead, a similar increase in the income share of the bottom 20 percent (the poor) is associated with 0.38 percentage point higher growth.”
The report goes on to say that the positive effect on growth holds true also for increasing the share of income for the middle classes – it’s only when the richest get more that we’re all worse off overall. This is hardly surprising. The poor tend to spend more of their income, not least on the basic necessities of life. The rich are more likely to save theirs – and, for the richest, often tuck it away in some offshore tax haven!
Spirit Level
In their 2009 book The Spirit Level, Richard Wilkinson and Kate Pickett demonstrated that more unequal societies had worse performance over a range of social outcomes:
- Community life and social outcomes
- Mental health and drug use
- Physical health and life expectancy
- Obesity
- Educational performance
- Teenage births
- Violence
- Imprisonment and punishment
- Social mobility
The book goes on to state a plausible mechanism to explain why inequality has an adverse effect on each of these outcomes. If growing inequality does indeed cause all these societal problems, it’s not hard to imagine that the overall growth in the economy is reduced as well.
Concentrating Wealth
Britain does worse than most comparable countries when it comes to wealth inequality – and we’re getting more unequal faster than them. The graphs from the IMF report illustrate this, showing the proportion of all wealth owned by the top 1% and the bottom 90% of the population, for 1980 and 2010.
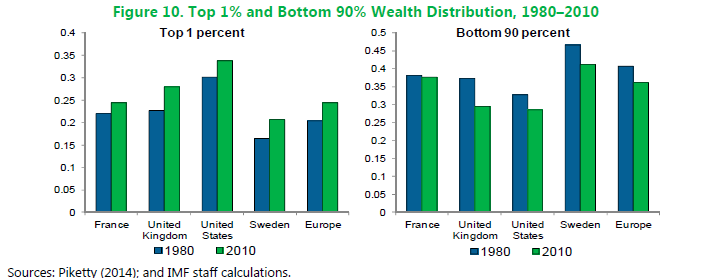 In the UK, the top 1% own almost as much wealth as the bottom 90% of the population. Only the USA has greater inequality and the gap between the blue (1980) and green (2010) bars is biggest for the UK. Sweden, by comparison, although getting worse, shows that it doesn’t have to be this unequal.