Category Archives: The economy

Posts about the economy and matters economic

Inequality Damages Your Wealth

One of the assertions made by free market fundamentalists is the “trickle-down effect”: making rich people richer by cutting their taxes benefits everyone, as their extra wealth trickles down to the rest of us. I have long doubted this; a recent IMF report provides further evidence that this is not so.

To quote from the report:

If the income share of the top 20 percent increases by 1 percentage point, GDP growth is actually 0.08 percentage point lower in the following five years, suggesting that the benefits do not trickle down. Instead, a similar increase in the income share of the bottom 20 percent (the poor) is associated with 0.38 percentage point higher growth.”

The report goes on to say that the positive effect on growth holds true also for increasing the share of income for the middle classes – it’s only when the richest get more that we’re all worse off overall. This is hardly surprising. The poor tend to spend more of their income, not least on the basic necessities of life. The rich are more likely to save theirs – and, for the richest, often tuck it away in some offshore tax haven!

Spirit Level

In their 2009 book The Spirit Level, Richard Wilkinson and Kate Pickett demonstrated that more unequal societies had worse performance over a range of social outcomes:

  • Community life and social outcomes
  • Mental health and drug use
  • Physical health and life expectancy
  • Obesity
  • Educational performance
  • Teenage births
  • Violence
  • Imprisonment and punishment
  • Social mobility

The book goes on to state a plausible mechanism to explain why inequality has an adverse effect on each of these outcomes. If growing inequality does indeed cause all these societal problems, it’s not hard to imagine that the overall growth in the economy is reduced as well.

Concentrating Wealth

Britain does worse than most comparable countries when it comes to wealth inequality – and we’re getting more unequal faster than them. The graphs from the IMF report illustrate this, showing the proportion of all wealth owned by the top 1% and the bottom 90% of the population, for 1980 and 2010.

Top 1 percent and bottom 90 percent sharesIn the UK, the top 1% own almost as much wealth as the bottom 90% of the population. Only the USA has greater inequality and the gap between the blue (1980) and green (2010) bars is biggest for the UK. Sweden, by comparison, although getting worse, shows that it doesn’t have to be this unequal.

Facebooktwitterredditpinterestlinkedinmail
twitterrss

Cat and Mouse

I don’t want to live in a society where I have to shop around every few months for my energy supply to stop me being ripped off by my current supplier.

Cat and mouse

Since our former public monopoly gas and electricity suppliers were privatised by the Thatcher government in the 1980s, the private companies that replaced them have been playing a game of cat and mouse on two fronts:

  • with the regulator, Ofgem;
  • with their customers.

With Ofgem, this has mainly taken the form of a bewildering mix of different tariffs, designed to make it as difficult as possible to compare prices.

The game with customers mainly focussed on winning market share in an oligopolistic market. The consequence is to offer discounts and/or more attractive tariff packages to new customers, whilst pushing up prices to existing ones. In other words, customer loyalty is penalised and everyone has to play the game of shopping around.

The energy companies didn’t invent this practice: the insurance industry led the way, as they institutionalised greed and treating their customers as a cash cow. The phone companies have also jumped onto this bandwagon.

Natural Monopolies

Even at the time the companies were privatised, I felt the idea was wrong. Gas and electricity retailing is a natural monopoly: it’s the same gas and electricity coming down the pipes and wires regardless of whom your contract is with. These industries do not form a natural market: such competition as exists is on the periphery of the service – billing and customer service – and not on the core offer.

Matters were made worse when the wholesale supply and distribution business was privatised a few years later. These industries require long-term investment, for example, in new power stations. Also, there are major externalities, such as climate change and air pollution, which should be factored in at a strategic level. Similarly, security of supply is paramount, given how much of modern life is dependent on these supplies always being there. Short-term focussed, profit-maximizing competing companies don’t match these needs.

Consumer Benefits?

Have consumers benefited from cheaper prices or better services? I doubt it, at least in the longer term. There may have been some price cutting to benefit consumers in the early days, but prices have risen faster in recent years and I am convinced we’re paying more now than we would have done under public ownership. Like the petrol retailers, gas and electricity companies are quick to raise the retail price when the wholesale price rises, and very slow to lower it when the wholesale price falls. Furthermore, the various comparison websites will quickly tell you how patchy customer service is.

Dogma Rules

What got us into this sorry mess is the mindless application of the dogma I described as “free market fundamentalism” in my earlier post Some Are More Equal. If you have a basic universal need for energy like gas and electricity, what’s wrong with it being met by an organisation driven from top to bottom by a commitment to public service principles?

Facebooktwitterredditpinterestlinkedinmail
twitterrss

A House Is Not a Home

… when it’s an investment.

The rot started before Thatcher: she merely picked up on a changing public mood.

We’ve been talking about houses as investments for many years now and it distorts completely any rational discussion about Britain’s housing needs. The idea of “an Englishman’s home is his castle” has been around for centuries. But then people started seeing houses as more than the place where you put down your roots, live your life, bring up a family, socialize with friends and become part of your community.

For most goods and services, a price rise is generally seen as a bad thing, reducing people’s disposable income and risking a rise in inflation. Not so with housing, where a reverse logic applies. This upside-down view comes naturally for richer politicians, economists and journalists who are on the (capital) gaining side of the equation.

Housing Divides Us

But the practical result is that, as Britain becomes a more and more divided society, one of the stark distinctions between the “haves” and the “have-nots” is the ability to afford a home of your own. Those lucky enough to be homeowners already have been able to use their unearned capital gains in a variety of ways. But would-be first time buyers are being put in an ever more desperate position. The maps below show the contrast in housing affordability over the past 20 years, based upon average* incomes and average house prices, area by area.

Spread of unaffordability mapsWith blue the most affordable and red the least, the change is dramatic. In 1995, an average earner would need to spend between 3.2 and 4.4 times their salary to buy an average-priced house in their area. In 2014, the corresponding figures are between 6.1 and 12.2 times salary. In both years, unsurprisingly, the highest ratios are for London. Here, average earners now stand no chance of getting onto the housing ladder without the help of rich parents or some other equivalent advantage.

Too Few New Houses

How we came to this ridiculous state of affairs is easy to see when you look at the graph below, showing UK house building over the past 45 years. From an annual figure of around 300,000 new homes in the 1970s, often higher, the rate drops sharply following the oil price shock of the mid-1970s. After a small rally in the early 1980s, it falls to 180,000 at the end of the Thatcher and Major governments. A steady but modest rise occurs in the housebuilding rate in the New Labour period prior to the 2008 financial crisis. The crash resulted in new lows of fewer than 150,000 new homes a year, a rate which failed to recover under the 2010-15 coalition. Housing experts state that we need 200-250,000 new homes a year to keep up with demand.

housing completions

The Rise of the Private Landlord

Matters have been made worse by a huge rise in the buy-to-let market. A significant proportion of former council properties, sold off after Thatcher’s “Right to Buy” policy, have eventually ended up on the buy-to-let market. The graph below shows trends over a 10 year period to 2012.

Housing shared tend graphDuring this period, the total housing stock has risen from 25.6 million homes in 2001-2 to 27.8 million ten years later. The proportion of public sector homes fell from 21% to 18% as new public sector house building failed to keep pace with the loss through council house sales. A more dramatic drop in owner-occupied properties, from 69% to 64% demonstrates the increasing problem for first time buyers to enter the market. The slack, as can clearly be seen, has been taken up by the private rented market. Its share of the housing stock has nearly doubled, from just under 10% to 18%.

Increasing Benefits Bill

The insufficiency of house building over a long period, together with a major swing to the private rented sector has driven up housing costs dramatically, even more for those renting than for owner-occupiers. The consequential rising cost of housing benefit is one of the two major causes of the rise in social security costs over the last decade or two. (The other is our ageing population, whose pensions have been protected.) The extra public spending has gone to private landlords.

Conclusion

It does not need much mental effort to conclude that:

  • The UK housing market is dysfunctional
  • Those suffering most are those least able to afford decent housing
  • Benefit caps pile more suffering on those same people
  • Osborne’s plan to sell off the more desirable Housing Association stock simply makes the problem worse:
    • It will shift more housing from public to private rented
    • It will drive up average rents
  • Jeremy Corbyn’s “People’s Quantitative Easing” to pay for more public housing looks quite sensible:
    • It will increase the supply of genuinely affordable housing
    • It will reduce the benefits bill.

And all because we’ve been conditioned into seeing houses as financial investments instead of homes!

*median figures used throughout

Acknowledgements to: theguardian.com (03/09/2015), Channel 4 and the Office of National Statistics for source data

Facebooktwitterredditpinterestlinkedinmail
twitterrss

Death of the Northern Powerhouse

With news of the cancellation, only 6 weeks after the election, of major rail improvements to support the creation of a “Northern Powerhouse”, here’s a tale of when the last one was killed off by the first wave of free market fundamentalism.

In the summer of 1980, my boss thought it would be a good idea for me to attend the Oxford University Business Summer School. This was a course aimed at aspiring managers and was essentially the economics part of the first year PPE (politics, philosophy and economics) undergraduate course, crammed into three weeks of study. My fellow students came from medium to large employers across the country, in a variety of different sectors of the economy.

1980 saw the first of the home-grown and entirely unnecessary economic slumps, this one brought on by Thatcher’s great experiment called monetarism, at that time part of the new religion of Free Market Fundamentalism. (See my earlier post, Jam tomorrow on the M3, for more on my views of monetarism.) The recession was hitting manufacturing and the north of England particularly hard. Some of my co-learners worked in such industries.

We had many after-dinner speakers from the upper echelons of politics, academia, business and trade unions (yes, they were still listened to then). One speaker I particularly remember was one of the first of the new breed of City traders. His talk started by gently ridiculing the Old City Gentleman (seen on the left below), with his old-school tie code of ethics: “my word is my bond”, etc. He compared this unfavourably with the shiny, thrusting new City type (such as himself), who would sweep away the old ways. (The City “Big Bang” of deregulation was still a couple of years away.)

In the picture he painted, the new City was one enormous game of monopoly (playing with other people’s money), huge fun and with lots of money to be made. He all but invited his audience to abandon their own careers and follow the path he’d chosen.

Old and New City gents
City Gents – old and new

During the question and answer session which followed, the discussion got quite heated. I distinctly remember two fellow students from northern industries: they were solid, respectable and, in all probability, “natural” Conservative voters. In the debate, they got very angry indeed, forcefully pointing out the enormous problems government policies were causing their industries, especially for exports.

There was absolutely no meeting of minds: they were living in different worlds.

I don’t know to this day whether my fellow students prospered or even if their companies survived. Nor, indeed, how many millions our city friend went on to make. But I did see at first hand the very personal pressures that were only just beginning as a result of the irresistible rise of the City and the destruction of our former northern industries.

Osborne was, until yesterday, speaking of a great revival of a northern powerhouse. It would have been a great deal simpler if his predecessors hadn’t destroyed the one we had in the first place.

Facebooktwitterredditpinterestlinkedinmail
twitterrss

Stuck Inside of Mobile

… with the Oxbridge Blues again

One of the enduring myths in Britain is that grammar schools aided social mobility. I will aim to demonstrate this really is a myth.

It’s undeniable that the UK has the worst record on social mobility in the western world: the graph below, taken from a just-published IMF report, shows the UK (alongside Italy) firmly at the top of the graph – which means we’re the (equal) least socially mobile country in the developed world.

Inequality and Mobility graph

So where does the myth come from? Ofsted disagrees, so it’s not them. One source is Conservative Voice, the Telegraph quoted Boris Johnson as saying so and Nigel Farage in the Express reminds us it was all Margaret Thatcher’s fault! But then, some commentators in the Telegraph disagree with others…

It’s generally agreed that social mobility was greater in the 1950s and 1960s than today and there were more grammar schools around then. But that coincidence proves nothing.

Changes in the Economy

During the 1950s and 60s, there was a major shift in working patterns, as increasing disposable income and technological progress shifted the balance of employment away from traditional working class jobs to a higher proportion of white-collar workers. Growth averaged 2.8% a year. This shift in the economy created the demand for more middle-class workers, which necessarily meant that many people from a working-class background moved up the social ladder.

By contrast, between 1980 and 2014, when growth was lower at 2.1% and most of that was grabbed by top earners as inequality increased, technology tended to destroy the middle-class jobs that were created a few decades earlier. More recently, the shift away from reliable, well-paid jobs to part-time and zero hours contracts has witnessed a halt to long-term rising productivity and standards of living. Who would have imagined forty years ago that carwash machines would be replaced by manual labour in the 21st century?

So, for social mobility, “it’s the economy, stupid” that did it – not the education system.

Other Countries

Another look at the graph above shows that, as to be expected, social mobility in the Scandinavian countries, clustered around the bottom-left of the graph, have very much higher rates of social mobility. But all these countries have some sort of comprehensive education system. So, their schools are not holding them back. It’s also striking how low inequality goes with high social mobility. This is fairly obvious if you think of mobility as a ladder. It’s much easier to climb if the ladder isn’t so long and the spaces between the rungs are closer together.

So let’s kill off the “return to grammar schools” myth once and for all.

Myth Two

And while we’re myth-busting, take a last look at the graph above and notice which country is next-highest on the graph (meaning second worst for social mobility). It’s the United States of America, the most unequal of all the western states. So the Great American Dream that, through hard work, anyone in America can make it to the top is also a myth. As Harvard Professor Michael Sandel said in a 2011 lecture broadcast on BBC4, “The American Dream is alive and well – and living in Denmark”.

So that’s two myths busted for the price of one!

Facebooktwitterredditpinterestlinkedinmail
twitterrss

So, Was It Labour’s Fault?

Before the Tories finally get away with their version of history, let’s look at a few facts….

Debt

In 2010, the UK government debt stood at £1,100 billion pounds, no small sum! But when expressed as a percentage of Gross Domestic Product (GDP) – roughly national “turnover” – this comparison with other countries in 2010 gives some perspective:
Greece:                       170%
USA:                               90%
France:                       110%
Germany:                    95%
UK:                                 60%
So, in comparison with other countries, our debt was relatively small.

Yes, but how does this compare with past years? This graph gives some perspective:

UK National DebtOver a 300 year perspective, debt rose slowly and then more rapidly to its all-time peak, just after the battle of Waterloo in 1815, of over 2½ years’ GDP. The next 100 years were spent slowly paying off this debt. The years from 1914 to 1945 show a sharp rise, reaching almost the same peak level at 238% of GDP in 1945. It then fell to a low of 29% and has continued to rise after 2010 to around 80% today, the steep rise following the global economic crash in 2008. (It’s worth noting, in passing, that the near-record levels of debt in 1945 did not prevent the Labour government creating the NHS three years later – and that wars are very expensive!!)

So, debt in 2010 was not exceptionally high by historical standards.

Deficit

So, what about the deficit: the ability of the government to live within its means in any one year? This graph shows the position since the start of the Thatcher government in 1979:

UK deficit 1979 to 2015The solid blue and red bars above show the actual deficit for each year of Conservative (or Conservative-led) and Labour governments respectively. The pale pink shows a hypothetical scenario for the years 2002-3 to 2007-8, which is when the Tories said Labour should have had a budget surplus. I’ve used a fairly arbitrary figure of 1.3%, which, by historical standards, would have been quite an achievement.

So what can we tell from the figures?

  • Their track record shows the Tories are in no position to lecture Labour about budget surpluses!
  • At March 2002, the final year of Labour surpluses, national debt stood at 29.3%, close to the record low.
  • Six years later, after Labour “profligacy” and at the start of the global crash, it had risen to 36.7%, a rise of just over one percentage point a year.
  • In the next two years, deficits rose sharply causing the debt to shoot up another 25 percentage points, to 62%. This resulted from the “nationalisation” of record private debts by rescuing the banks and pumping money into the economy.
  • Deficits then slowly decline to around half the 2010 level, in contrast to Osborne’s prediction, at the 2010 “emergency” budget, of eliminating the deficit by 2015.

What conclusions can we draw? On some simplifying assumptions (which work very much in the Tories’ favour), if Brown and Darling had followed Osborne’s retrospective advice, national debt would have fallen to a 300-year low of 25% of GDP at the start of the crash, rather than the actual 37%. This certainly would have helped a bit, but is enormously overshadowed by the effects of the recklessness of the financial sector.

Who’s to Blame?

No one saw the crash coming in 2007-8. Mervyn King, Governor of the Bank of England said it wasn’t Labour’s fault, but rather “a shared intellectual view right across the entire political spectrum”. Even using my simplifying calculations (heavily biased in the Tories’ favour), blame would be apportioned:

  • 80% financial sector
  • 20% Labour Government.

And that’s before we even consider the benefits (Sure Start centres, increased NHS spending, etc.) that the extra money was used for.

One final thought about numbers – just a coincidence, I’m sure:

  • 37%: National debt at the start of the crash
  • 37%: Proportion of the vote to secure a Tory Government in 2015.

It’s a funny old world, isn’t it?


Facebooktwitterredditpinterestlinkedinmail
twitterrss

Why George Osborne Is Only Half Human*

* economically speaking

Two events from recent history:

  1. The Berlin Wall fell in 1989 – the symbolic end to communism as a way of organising society and the economy.
  2. With the collapse of Lehman Brothers and government rescue of failing banks, Free Market Fundamentalism – my term for neoliberalism or neoconservatism – collapsed in 2008.

No serious commentator in the west or in the former Soviet bloc doubts event one, but many are still in denial about event two. Gideon George Osborne is one such person.

The “EffEmEffs”

Now, to back-track a bit. (This is not meant to be a lecture on the history of economics. Much, perhaps too much, has already been written on the clash of the ideas of Keynes and those of Hayek and Friedman. Suffice it to stay, the latter got the upper hand nearly forty years ago and won’t let go.)

As is well known, the core message of free market fundamentalism is that market forces are the best and most efficient way of organising society and the economy. Each individual pursuing his or her own interests leads to the best possible outcomes. Governments should “keep out” from interfering in the workings of markets.

I was instinctively against such ideas when they first emerged into public debate in the early 1980s, but could not articulate a full, coherent argument against the FMF movement.

Markets Increase Inequality

It was clear even then that free markets, left to themselves, would, over time, lead to ever increasing levels of inequality. The “invisible hand” of millions of individual decisions about which products and services would be bought and sold, and at what price, inevitably leads to an economy at odds with people’s preferred wishes overall. There would be more luxury goods in the world and fewer doctors, nurses and teachers than people would choose if asked to express their priorities directly. The reason is simple: in free markets, choices are made by the “votes” of each transaction: the more money someone has, the more “votes”. Markets thus respond in a way that makes poor people poorer and the rich richer. Even the smallest initial levels of inequality, processed through the amplifying effect of repeated transactions with the rich getting most say, lead to an ever-widening gap between rich and poor. This is an immutable law of free markets.

The Psychopathic Economy

Imagine for a moment, if you will, that the economy is a person. We would say that that person, exhibiting the behaviour required by the FMFs, has a severe personality disorder. Such a person would have a high risk of antisocial, predatory or even criminal behaviour. In lay terms, we’d call them a psychopath.

Curiosity Conscience Competition CompassionNow, using the Four Cs framework from my earlier post Being Human II: The Four Cs, it is easy to see why this should be so. Free market rules (i.e. pursuing self-interest) do not represent human thinking. The twin attributes “curiosity” and “competition” are modelled fully in the workings of markets. But the balancing attributes of “conscience” and “compassion” are missing completely.

George Osborne is our national cheerleader for the “EffEmEffs”. And it’s in that way that he is only half human.

Facebooktwitterredditpinterestlinkedinmail
twitterrss

Jam Tomorrow on the M3

Do you remember M3? Or M1? Or M0? No, I’m not talking motorways here, I’m referring to monetarism.

Ah…! Monetarism: the new religion of the early 1980s.

In the late 1970s, the standard methods of managing the economy seemed no longer to work. Major shocks, such as the five-fold increase in the oil price, had wreaked havoc. Enter the Chicago school of economics under their leader Milton Friedman. Much has been written about his ideas and I don’t plan to repeat them here. But these ideas had a profound effect on government thinking which continue to this day. Even Dennis Healy, Chancellor in Jim Callaghan’s government, seemed to think there was something worth considering. But it was Margaret Thatcher and Chancellor Geoffrey Howe who were the true believers.

There was much talk about the definition of what was money – hence the various M’s – and its “velocity of circulation”, which was asserted to be stable, at least in the long term. Followers of Keynes hit back with their hero’s famous “In the long run, we’re all dead” quote from 1923. But, at the start of the 1980s, Howe pressed ahead with great vigour to implement policies based upon Chicago school thinking.

And what happened?

Uk Growth 1975 to 1986
UK National Growth 1975-86

As can be seen from the graph, the great monetarist experiment plunged Britain into a wholly unnecessary recession, which lasted about three years. The main consequence was the permanent destruction of much of our manufacturing industry, from which we have never recovered. The very lop-sided state of our economy towards services, and in particular financial services, starts here – we never did get the “jam tomorrow” promised by the theorists.

Facebooktwitterredditpinterestlinkedinmail
twitterrss

Freedom or Crucifixion?

Towards the end of Monty Python’s Life of Brian film, there is a scene where a row of condemned prisoners shuffle past a sympathetic Roman officer (played by Michael Palin). He checks each prisoner to ensure they are in the right line and asks each in turn “Crucifixion?” The first few prisoners confirm this and the officer directs them to where they can pick up their crosses. One prisoner tries it on: he says it was all a mistake and that he was promised his freedom. The officer immediately believes him but, on the brink of his release, the prisoner admits he was lying and he’s really due for crucifixion.

Given the choice, would you opt for freedom or crucifixion? The answer, in modern parlance, is a “no brainer”.

Thomas Picketty’s book Capital in the 21st Century is a review of western capitalism over the past 200 years. Some of the more depressing findings in the book are:

  • Income inequality was extremely high in Europe just before World War I
  • Inequality in the USA has now risen above this level, with Britain and other main European countries not far behind (see chart below)
  • The fall in inequality in the mid-20th century was the result of the two world wars; inequality is now climbing back to its “natural” level.
Income of top ten percent
Proportion of national income going to top 10% (click to enlarge)

The graph above shows a measure of inequality of income; inequality of wealth is far higher.

Picketty argues that the fall in inequality after the wars was due to a combination of two exceptional factors:

  1. The physical destruction of capital and the earnings derived from it, through real estate, bonds, stocks and shares, etc.
  2. Emergency high levels of progressive taxation and similar policies (war bonds, etc.) made possible by changes in popular attitude: wartime solidarity, need to rebuild infrastructure, etc.

He goes on to show that, under current economic policies, inequality will continue to rise to equal or surpass the pre-1914 levels. He argues that, in the long term, this would be incompatible with modern liberal democracy: sooner or later, it will end in tears – war or revolution or some such. He suggests a less violent alternative:

  • increased progressive taxation (especially on wealth)
  • closer international cooperation on taxation policy, starting with the countries of the EU
  • inter-governmental exchange of data to give transparency of global wealth.

These measures would also enable systematic steps to reduce or eliminate tax havens, currently estimated by Gabriel Zucman of the LSE to harbour about 10% of global GDP.

So, what’s it to be? War or taxation? Freedom or crucifixion? It’s a no brainer.

Facebooktwitterredditpinterestlinkedinmail
twitterrss

New Cameronia: a Review from 2019

7th May 2019

With just one year to go before the 2020 General Election, Guardian journalists review the achievements of the Government in the last four years.

Economy

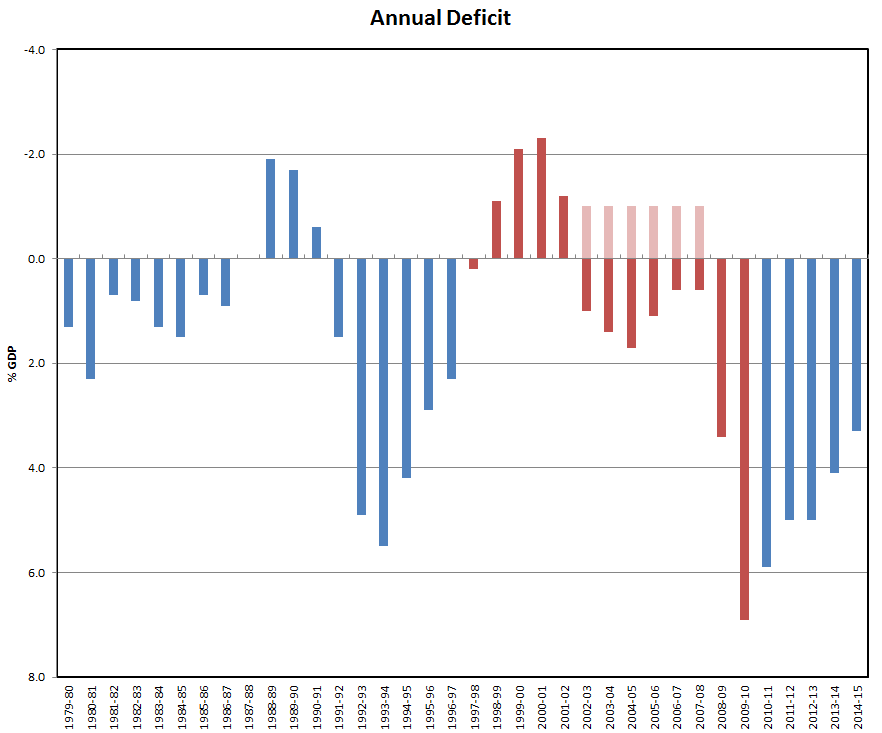
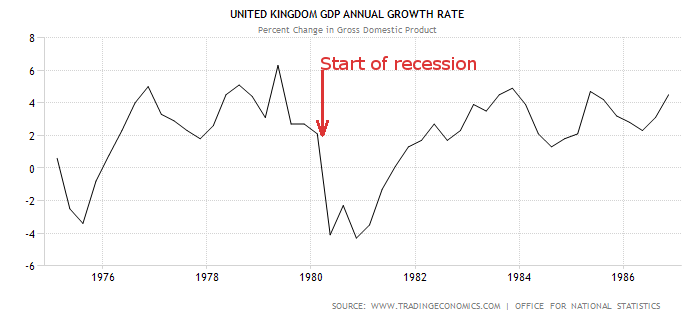
Following phase two of austerity measures introduced after the 2015 general election, the UK economy returned to recession in Q4 2015. In a rare show of consensus, economists agreed that the Chancellor had simply repeated the same mistakes from five years earlier.

Thanks to effective news management from Tory-supporting newspapers, public opinion swiftly blamed the new economic crisis on a combination of the EU, immigrants, the poor and the mess left by Labour in 2010.

Europe

David Cameron began well at the start of the promised renegotiations of the UK’s relationship with the EU, by promising to “look after Britain’s interests” whilst “keeping the UK at the heart of Europe”. However, his negotiating style quickly returned to form: lecturing to all foreigners and getting very red in the face when they disagreed with him. His potentially closest allies in Europe quickly lost patience and any sympathy for the UK’s position. This led to a complete breakdown in negotiations. This forced Cameron to throw his full weight behind the “out” campaign in the late 2016 referendum.

Scottish Devolution

A similar negotiating style on devolution terms for Scotland led to the Scots unilaterally deciding to hold a second referendum on leaving the UK: this time, the vote was 63% “yes”. Cameron initially refused to recognise the vote as legitimate, but, as a result of the small Conservative majority, the threat of a revolt from ten of his “glad to see the back of them” backbench MPs forced him to accede to the Scots’ demands.

On 1st January 2018, the UK left the EU and Scotland left the UK on 24th June the same year. Nicola Sturgeon had successfully negotiated an interim arrangement whereby Scotland kept all the rights and obligations of EU membership between these two dates.

Northern Powerhouse

Initially, the renewed offer by the Chancellor of devolved powers for northern cities was met with a warm reception. When an observant northern city councillor revealed that the “small print” in the deal meant that the “powerhouse” proposal was no more than a smokescreen for further cuts in Whitehall funding for local government, the atmosphere quickly soured.

A Treasury spokesperson attempted to justify the cuts using the argument that the entrepreneurial spirit “set free” by the proposals would mean northern cities would need less “subsidy” from the south. Critics soon compared this assertion with the argument used for the, now twice failed, claims in 2010 and 2015 that cuts to public spending would help get the economy moving.

A small group of Labour councillors in Manchester led a campaign “the Tories don’t care about us up north” which quickly took hold of public opinion there. Demonstrations, followed by rioting akin to that seen in the Thatcher years over the Scottish poll tax “experiment”, soon got out of hand. In the aftermath of the riots, the “offer” of devolved government was withdrawn by Westminster.

Boundary Changes

Negotiations between Holyrood and Westminster proved tough for Cameron, particularly after the northern riots. Eventually, he was forced to concede that the former border between England and Scotland be moved roughly 250 miles south, with some detailed boundary issues still to be settled at the time of writing.

Two significant enclaves were agreed, one north and one south of the new border, to allow for exceptional cases.

In the north, Cheshire opted to remain in the former England, and a short stretch of the M6 was appropriated as a “safe passage” for residents of Cheshire to travel “without hindrance” to the southern mainland.

In the south, following a remarkable campaign by a group of leading academics, hi-tech business leaders worried about loss of EU markets, students and party activists, Cambridge staged its own referendum in which they overwhelmingly voted to join Scotland. A section of the A1 and A14 was similarly reserved for Cambridge residents to travel freely north. As a precaution, the security barrier on the A1 was built to a greater height and with additional security features at the Grantham bypass.

The tabloids quickly dubbed the security fence the “Farage Barrage” and the Cheshire enclave “Dacre’s Acres”. The latter was in honour of the leader of the most consistent misinformation campaign for the Tories and as a topical reference to the reintroduction, in the south, of capital punishment – for anyone found using metric measurements.

Welcoming Cambridge and northern England to the Holyrood parliament, Sturgeon stated that Scotland would be the heart, Cambridge the brains and northern England really would be the manufacturing powerhouse of the newly independent country.

The New Free State

Three months before the start of border controls between the new “Caledonia” and “Cameronia”, residents of Lincolnshire objected to the inconvenience of having the A1 as a barrier to the shortest routes to other parts of England. An informal local plebiscite led to Lincolnshire opting to join the new Free State of Greater Clacton and thereby opting out of both their new neighbours.

Welfare Reform

In his first move following partition, Ian Duncan Smith successfully negotiated an exception to the total closure of borders between Greater Clacton and the rest of the world. This was to sub-contract all the work of Job Centre Plus offices – now re-branded Work Makes Free – to new processing centres in Lincolnshire. To overcome the problems of very poor transport links in the area, all roads were designated one-way only (inbound). Benefit claimants will now need to make their way as best they can to the new centres.

Trade and Immigration

Cameronia’s record – and rising – trade deficit was reduced temporarily by the loss of two key ports: Felixtowe, now permanently closed, and Liverpool, now in Caledonia. Work started to revive the fortunes of the port of Bristol. This was helped by the small-scale reintroduction of the slave trade, otherwise known as “tier 2 immigrants” in the new two-tier immigration points system. Tier 1 immigrants, who are allowed unrestricted rights to enter and leave Cameronia, are now defined as those with an annual income of at least £1.5 million, or capital of £100 million.

In Other News…

Sport

  • The national boundary change forced Aston Villa Football Club to relocate to West Ham at the start of the 2018-19 season.

Transport

  • Chaos on the A14 as academics from other Universities in the south try to reach Cambridge before the border closes.
  • TfL re-brands the Oyster Card: now called the Shark Card. All card purchasers must show proof of income of at least £150,000p.a. The poor must use the (reduced) bus services only. With the London Congestion Charge abolished for company cars, bus journeys are slower. Health experts have expressed fears of a serious health crisis, with poor workers in London now averaging less than 3hrs sleep a night, in order to get to work on time.
  • In an unusual case of nominative determinism, the operators of the newly-opened Crossrail service state that all users must carry a copy of the Daily Mail or Daily Telegraph when travelling. Commuters are required to look up from their newspapers at frequent intervals and make disapproving tutting sounds to show how cross they are – about benefit scroungers, poor people, single mothers, etc.
  • Osborne announces that completion of the HS2 rail link is to be brought forward and the route modified, with the northern terminus at Tatton.
  • Richard Branson said he was “shocked” to discover that Virgin Trains is the surprise winner of the Islamic State Railways contract.

Law / Open Government

  • The Freedom of Information Act is replaced by a Freedom of Misinformation Act, dubbed the “Right to Lie”. This grants government ministers and newspapers (except those not owned by tax-avoiding multimillionaires) full legal indemnity when stating any untruths . Ministers quietly slipped in a clause allowing the Prince of Wales to place black spiders on opposition benches in the House of Commons, to disrupt speeches.

Europe

  • A group of leading academics and economists presented a controversial report to the European Parliament about the effects of deregulation of financial services since the 1980s. The report concluded that all new financial products and services introduced since then were essentially giant Ponzi schemes designed to transfer wealth from middle- and low-income households to the super-rich and were of negative social value. The EU parliament voted by a 2 to 1 majority to ban these new practices within the EU within a 3-year period. After fierce negotiations, the EU Council of Ministers reluctantly agreed parliament’s recommendations.

Financial Services Regulation

  • Cameron steadfastly refused to make any changes to City practices following EU pressure. As a result of this refusal and Cameronia’s opting out of European Human Rights regulations, EU trade sanctions were imposed from 1st January 2019. Estimated job losses from these sanctions and the relocation of many multinationals following Brexit vary between 2 and 5 million.
  • A reluctant President Clinton eventually agrees to reform Wall Street slowly – arguing to her domestic objectors that the USA’s much broader economic base than former UK means that Americans will benefit in the longer term.

Employment

  • Following the abolition of all employment laws, companies increasingly introduce “registration fees” – typically £50 to £75 a week – for workers to retain the privilege of zero hours contracts. This, in turn, sparks a rapid increase in “no gain no pain” lawyers typically charging non-refundable fees of £250 to workers disadvantaged by the changes.

Families

  • Social workers report that sexual abuse within families has risen 25% following the limitation of housing benefit to one bedroom only, regardless of family size.

Religion

  • The Archbishop of Canterbury announced the discovery of a rare early scroll casting new light on the scriptures. The archbishop stated that one of Jesus’ most famous sayings was misquoted and should now read: “the poor shall inhabit the earth” (see also Lincolnshire above).

Consumer

  • In an unusual example of government interference in the workings of the free market, a Customer Loyalty Penalty act was introduced, to demonstrate that competition is always the best way to protect consumer interests. The Act decrees that all utility and insurance companies must impose a minimum 10% plus inflation price increase for any consumer too lazy to switch providers on renewal. Experts say this will make very little difference, as it merely formalizes current practice.

Politics

  • George Osborne finally announces what many had suspected: that his part-time job as Chancellor of the Exchequer is too disruptive of his main role as chief political strategist for the Tory party. The job will be devolved to the “big four” accountancy firms Deloitte, PwC, Ernst and Young and KPMG. Contracts will be awarded and managed by newly-created Criminal Commissioning Groups run by convicted fraudsters.
  • MPs have voted to award themselves an annual pay rise of 25% for each year of this parliament. Ministers state that money will be saved overall by the introduction of a disloyalty penalty. An MP’s salary will be permanently reduced by 10% each time he or she votes against the government. A threatened last-minute revolt by the few remaining Tory “awkward squad” backbenchers was headed off by the creation of an appeal panel to consider exceptions to the penalty rule. The panel members will be George Osborne, Michael Gove and Chris Grayling.
  • In an attempt to distract from the breakup of the United Kingdom, the Conservative Party has formally renamed itself the “Conservative United New Tories”.

Benefits

  • A new kitchen tax will be applied to all private dwellings with more than one kitchen. Tory party donors, government ministers and royal family members are exempt.

Health

  • The new Mental Health Act defines proponents of Health & Safety rules as having “gone mad”.

English Language

  • A small group of Oxford academics who chose not to move to Cambridge have been commissioned by the government to produce a New Oxford Dictionary: the Rightspeak Dictionary.
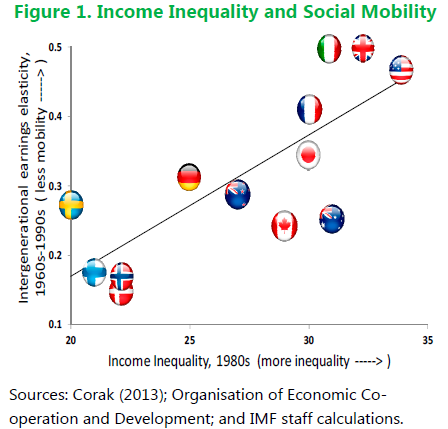
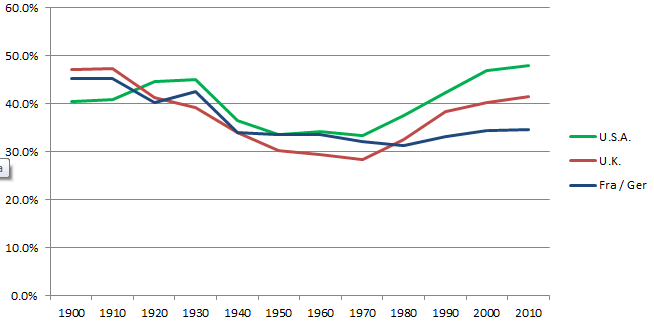
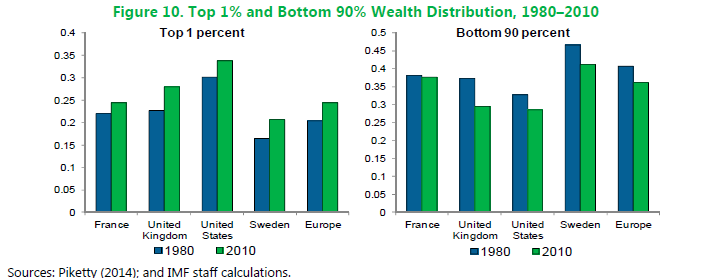
Facebooktwitterredditpinterestlinkedinmail
twitterrss